Main

January 17, 2018

Conference on Fairness, Accountability, and Transparency (FAT*) 2018

Conference on Fairness, Accountability, and
Transparency (FAT*)

Program for 2018 is out.
Conference on Fairness, Accountability, and
Transparency (FAT*) is from Conference on Fairness, Accountability, and
Transparency in Machine Learning (FATML).

November 10, 2017

Presence of other people change an individual's behavior? Norman Triplett

One of the seminal social-psychology studies, at the turn of the 20th century, asked a question that at the time was a novel one: How does the presence of other people change an individual's behavior?

Norman Triplett, a psychologist at Indiana University, found that when he asked children to execute a simple task (winding line on a fishing rod), they performed better in the company of other children than they did when alone in a room. Over the following decades, a new discipline grew up within psychology to further interrogate group dynamics: how social groups react in certain circumstances, how the many can affect the one.

Continue reading "Presence of other people change an individual's behavior? Norman Triplett" »

November 8, 2017

Replication studies

Jay Van Bavel, a social psychologist at New York University, has tweeted openly about a published nonreplication of one of his studies and believes, as any scientist would, that replications are an essential part of the process; nonetheless, he found the experience of being replicated painful. "It is terrifying, even if it's fair and within normal scientific bounds," he says. "Because of social media and how it travels -- you get pile-ons when the critique comes out, and 50 people share it in the view of thousands. That's horrifying for anyone who's critiqued, even if it's legitimate."

The field, clearly, was not moving forward as one. "In the beginning, I thought it was all ridiculous," says Finkel, who told me it took him a few years before he appreciated the importance of what became known as the replication movement. "It was like we had been having a big party -- what big, new, fun, cool stuff can we discover? And we forgot to double-check ourselves. And then the reformers were annoyed, because they felt like they had to come in after the fact and clean up after us. And it was true.

November 6, 2017

Dawn of p hacking

Simmons lost touch with Cuddy, who was by then teaching at Northwestern. He remained close to Nelson, who had befriended a behavioral scientist, also a skeptic, Uri Simonsohn. Nelson and Simonsohn kept up an email correspondence for years. They, along with Simmons, took particular umbrage when a prestigious journal accepted a paper from an emeritus professor of psychology at Cornell, Daryl Bem, who claimed that he had strong evidence for the existence of extrasensory perception. The paper struck them as the ultimate in bad-faith science. "How can something not be possible to cause something else?" Nelson says. "Oh, you reverse time, then it can't." And yet the methodology was supposedly sound. After years of debating among themselves, the three of them resolved to figure out how so many researchers were coming up with such unlikely results.

Over the course of several months of conference calls and computer simulations, the three researchers eventually determined that the enemy of science -- subjectivity -- had burrowed its way into the field's methodology more deeply than had been recognized. Typically, when researchers analyzed data, they were free to make various decisions, based on their judgment, about what data to maintain: whether it was wise, for example, to include experimental subjects whose results were really unusual or whether to exclude them; to add subjects to the sample or exclude additional subjects because of some experimental glitch. More often than not, those decisions -- always seemingly justified as a way of eliminating noise -- conveniently strengthened the findings' results. The field (hardly unique in this regard) had approved those kinds of tinkering for years, underappreciating just how powerfully they skewed the results in favor of false positives, particularly if two or three analyses were underway at the same time. The three eventually wrote about this phenomenon in a paper called "False-Positive Psychology," published in 2011. "Everyone knew it was wrong, but they thought it was wrong the way it's wrong to jaywalk," Simmons recently wrote in a paper taking stock of the field. "We decided to write 'False-Positive Psychology' when simulations revealed it was wrong the way it's wrong to rob a bank."

Simmons called those questionable research practices P-hacking, because researchers used them to lower a crucial measure of statistical significance known as the P-value. The P stands for probable, as in: How probable is it that researchers would happen to get the results they achieved -- or even more extreme ones -- if there were no phenomena, in truth, to observe? (And no systematic error.) For decades, the standard of so-called statistical significance -- also the hurdle to considering a study publishable -- has been a P-value of less than 5 percent.

Continue reading "Dawn of p hacking" »

August 4, 2017

Immigration in America is more popular than immigration in Town, ST, America

Lefteris Jason Anastasopoulos, a lecturer and data science fellow at Berkeley's School of Information, provides one answer: Support for immigration "may be greatly overestimated."

In an email, Anastasopoulos writes that

polls conducted by large survey organizations never ask about immigration in geographic context. Instead they ask questions about whether respondents support increasing immigration or granting amnesty for undocumented immigrants in the "United States" overall rather than, say, Dayton, Ohio, or Wilmington, North Carolina, places where immigration has been rapidly increasing over the past few years. This kind of abstract framing tends to push respondents toward giving more "politically correct" answers to standard poll questions about immigration.

The result is

a significant underestimation of the backlash against newly arriving immigrants and an overestimation of the support for immigration among the public.

July 22, 2017

Republican are residual of income over education

Mr. Trump did extremely well among voters who lack formal educational credentials but work hard enough to make incomes above the national median. This column will leave it to readers to decide how much myth-busting the authors have achieved with this insight. But for those liberals who are eager to continue looking down on Mr. Trump's voters, this analysis would seem to be very helpful.

The deplorables tend to have fewer academic credentials, so the deplorers can tell themselves that Trump voters lacked the intellectual tools to appreciate the superiority of Hillary Clinton over Mr. Trump.

-- Nicholas Carnes and Noam Lupu

July 16, 2017

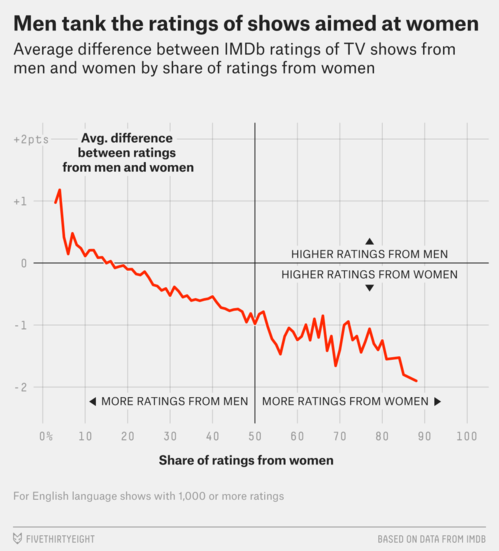
Chick flick ? Men give better ratings to TV shows watched by men.

Men give better ratings to TV shows watched by men.
Men give worse ratings to TV shows watched by women.

Women give better ratings to TV shows watched by women.
Women give worse ratings to TV shows watched by women.

The trend in men's ratings is stronger; and men give more "1" worst ratings (on a 1 to 10 scale) than women.

hickey-imdbmen-2.png


Via Walt Hickey, 538.

July 14, 2017

Predictions with multiple components-- if one part fails, overall prediction may still seem true

Nate Silver will make predictions that have multiple components, so that if one part fails, the overall prediction will seem to have come true, even if its coming true had no relation to the reasons Silver originally offered.

See, e.g., "It's a tight race. Clinton's the favorite but close enough that Trump would probably pull ahead if he 'wins' debate." Silver can look back and say "I saw that Trump could pull ahead."

But what he actually predicted was that Trump could pull ahead based on debate performance. If he pulls ahead for some other reason, Silver is completely wrong (because he had excluded that other possibility), yet he seems right.

Via

Continue reading "Predictions with multiple components-- if one part fails, overall prediction may still seem true" »

January 29, 2017

Minimum SAT score for college admission: varies by race ?

A 2009 Princeton study showed Asian-Americans had to score 140 points higher on their SATs than whites, 270 points higher than Hispanics and 450 points higher than blacks to have the same chance of admission to leading universities.

A lawsuit filed in 2014 accused Harvard of having a cap on the number of Asian students -- the percentage of Asians in Harvard's student body had remained about 16 percent to 19 percent for two decades even though the Asian-American percentage of the population had more than doubled. In 2016, the Asian American Coalition for Education filed a complaint with the Department of Education against Yale, where the Asian percentage had remained 13 percent to 16 percent for 20 years, as well as Brown and Dartmouth, urging investigation of their admissions practices for similar reasons.

Continue reading "Minimum SAT score for college admission: varies by race ?" »

January 26, 2017

Cambridge Analytica's psychographic profiling for behavioral microtargeting for election processes

Understand personality, not just demographics. OCEAN model: Openness, Conscientiousness, Extroversion, Agreeableness, Neuroticism.

In a 10 minute presentation at the 2016 Concordia Summit, Mr. Alexander Nix discusses the power of big data in global elections. Cambridge Analytica's revolutionary approach to audience targeting, data modeling, and psychographic profiling has made them a leader in behavioral micro-targeting for election processes around the world.

Cambridge's voter data innovations are built from a traditional five-factor model for gauging personality traits. The company uses ongoing nationwide survey data to evaluate voters in specific regions according to the OCEAN or CANOE factors of openness, conscientiousness, extroversion, agreeableness and neuroticism. The ultimate political application of the modeling system is to craft specific ad messages tailored to voter segments based on how they fall on the five-factor spectrum.

The number-crunching and analytics for Mr. Trump felt more like a "data experiment," said Matthew Oczkowski, head of product at Cambridge Analytica, who led the team for nearly six months.

Continue reading "Cambridge Analytica's psychographic profiling for behavioral microtargeting for election processes" »

May 26, 2016

Party to violence predicted

The Chicago police, which began creating the Strategic Subject List a few years ago, said they viewed it as in keeping with findings by Andrew Papachristos, a sociologist at Yale, who said that the city's homicides were concentrated within a relatively small number of social networks that represent a fraction of the population in high-crime neighborhoods.

Miles Wernick, a professor at the Illinois Institute of Technology, created the algorithm. It draws, the police say, on variables tied to a person's past behavior, particularly arrests and convictions, to predict who is most likely to become a "party to violence."

The police cited proprietary technology as the reason they would not make public the 10 variables used to create the list, but they said that some examples were questions like: Have you been shot before? Is your "trend line" for crimes increasing or decreasing? Do you have an arrest for weapons?

Dr. Wernick said the model intentionally avoided using variables that could discriminate in some way, like race, gender, ethnicity and geography.

Jonathan H. Lewin, the deputy chief of the Chicago Police Department's technology and records group, said: "This is not designed to replace the human process. This is just designed to inform it."

Continue reading "Party to violence predicted" »

May 13, 2016

Evaluating men and women on different traits, Rate My Professor

Benjamin Schmidt, a professor at Northeastern University, created a searchable database of roughly 14 million reviews from the Rate My Professor site.

Among the words more likely to be used to describe men: smart, idiot, interesting, boring, cool, creepy. And for women: sweet, shrill, warm, cold, beautiful, evil. "Funny" and "corny" were also used more often to describe men, while "organized" and "disorganized" showed up more for women.

In short, Schmidt says, men are more likely to be judged on an intelligence scale, while women are more likely to be judged on a nurturing scale.

"We're evaluating men and women on different traits or having different expectations for individuals who are doing the same job," says Erin Davis, who teaches gender studies at Cornell College.

May 5, 2016

Ranking or classifying adjacent words

I came across WordRank -- a fresh new approach to embedding words by looking at it as a ranking problem. In hindsight, this makes sense. In typical language modeling situation, NN based or otherwise, we are interested in this: you have a context cc, and you want to predict which word \hat{w}​w​^
​​ from your vocabulary \SigmaΣ will follow it. Naturally, this can be setup either as a ranking problem or a classification problem. If you are coming from the learning the rank camp, all sorts of bells might be going off at this point, and you might have several good reasons for favoring the ranking formulation. That's exactly what we see in this paper. By setting up word embedding as a ranking problem, you get a discriminative training regimen and built in attention-like capability (more on that later).

-- Summary by Delip Rao.

April 15, 2016

Facebook: leading the ranking algorithm

At first I was pretty proud of myself for messing with Facebook's algorithms. But after a little reflection I couldn't escape the feeling I hadn't really gamed anything. I'd created a joke that a lot of people enjoyed. They signaled their enjoyment, which gave Facebook the confidence to show the enjoyable joke to more people. There was nothing "incorrect" about that fake news being at the top of people's feeds. The system--in its murky recursive glory--did what it was supposed to do. And on the next earnings call Mark Zuckerberg can still boast high user engagement numbers.


-- Caleb Garling.

Continue reading "Facebook: leading the ranking algorithm" »

April 7, 2016

Datausa government data


Hal R. Varian, chief economist of Google, who has no connection to Data USA, called the site "very informative and aesthetically pleasing." The fact the government is making so much data publicly available, he added, is fueling creative work like Data USA.

Data USA embodies an approach to data analysis that will most likely become increasingly common, said Kris Hammond, a computer science professor at Northwestern University. The site makes assumptions about its users and programs those assumptions into its software, he said.

"It is driven by the idea that we can actually figure out what a user is going to want to know when they are looking at a data set," Mr. Hammond said.

Data scientists, he said, often bristle when such limitations are put into the tools they use. But they are the data world's power users, and power users are a limited market, said Mr. Hammond, who is also chief scientist at Narrative Science, a start-up that makes software to interpret data.

March 24, 2016

Economists need data

Angus Deaton, this year's winner of the Nobel in economic science, was honored for his rigorous and innovative use of data -- including the collection and use of new surveys on individuals' choices and behaviors -- to measure living standards and guide policy.

House Republicans, for example, have been especially scornful of the decennial census, the nation's most important statistical tool, and the related questionnaire, the American Community Survey. They have placed prohibitive constraints on the Census Bureau, including a mandate that it spend no more on the 2020 census than it spent on the 2010 census, despite inflation, population growth and technological change.

February 19, 2016

Delegate math vs Cruz 16 or Hillary 08

Leading proportional states but trailing in winner-take-all states does not add up to victory.

delegate allocation matrix puts Cruz's campaign at a serious disadvantage. For example, if Cruz wins the primary in his home state of Texas by one vote, he'll probably win a handful more delegates than his nearest competitor. By contrast, if Marco Rubio or Trump win Florida by one vote, either would win a whopping 99 more delegates than his nearest competitor

-- David Wasserman, U.S. House editor for the Cook Political Report, via 538.

January 12, 2016

Sharp divergence between pay at the most successful companies and also-rans in the same field

Bloom believes inequality is being magnified by technological change and what's known as skills bias, where workers with a particular expertise reap the biggest reward. Neither is amenable to quick fixes.

In Professor Bloom's new paper, which he wrote with David J. Price, a Stanford graduate student, and three other economists -- Jae Song, Fatih Guvenen and Till von Wachter -- the top quarter of 1 percent of Americans appears to be pulling away from the rest.

For workers at this threshold, who earn at least $640,000 annually, their salaries rose 96 percent from 1981 to 2013, after taking account of inflation.

The trend was especially pronounced among the most successful enterprises in the American economy, creating a divergence between the highest-paid people at companies that employ more than 10,000 people and the rest of the work force. In this rarefied circle, overall pay jumped 140 percent versus a 5 percent drop for the typical employee at these corporate behemoths.

The split in compensation between executives and everyone else was much less pronounced at smaller companies, according to the research by Mr. Bloom and his colleagues. At these firms, between 1981 and 2013, top salaries rose 49 percent, while median pay rose 30 percent.

In addition, Mr. Bloom and his team also found a sharp divergence between pay at the most successful companies and also-rans in the same field -- think Apple versus BlackBerry. The highest-paid workers cluster at the winners, heightening income disparities in the overall work force.

Mr. Bloom traces the outsize gains to large grants of stock and options to top workers at big companies, with their fortunes rising in line with the performance of the stock market.

"There used to be a premium for working at a big company, even in a lower-level job," he said. "That's not true anymore. The people who have really suffered are lower-level employees at big companies."

November 29, 2015

Proportionate response ?

Removing police racial bias will have little effect on the killing rate. Suppose each arrest creates an equal risk of shooting for both African-Americans and whites. In that case, with the current arrest rate, 28.9 percent of all those killed by police officers would still be African-American. This is only slightly smaller than the 31.8 percent of killings we actually see, and it is much greater than the 13.2 percent level of African-Americans in the overall population.

If the major problem is then that African-Americans have so many more encounters with police, we must ask why. Of course, with this as well, police prejudice may be playing a role. After all, police officers decide whom to stop or arrest.

But this is too large a problem to pin on individual officers.

First, the police are at least in part guided by suspect descriptions. And the descriptions provided by victims already show a large racial gap: Nearly 30 percent of reported offenders were black. So if the police simply stopped suspects at a rate matching these descriptions, African-Americans would be encountering police at a rate close to both the arrest and the killing rates.

Continue reading "Proportionate response ?" »

March 18, 2015

Radar.oreilly on interface languages to data science

Radar.oreilly on interface languages and feature discovery.

March 17, 2015

Shape of city blocks

Travel to any European city and the likelihood is that it will look and feel substantially different to modern American cities such as Los Angeles, San Diego, or Miami.

Ref: arxiv.org/abs/1410.2094 A Typology of Street Patterns

The reasons are many. Most older European cities have grown organically, usually before the advent of cars, with their road layout largely determined by factors such as local geography. By contrast, the growth of many American cities occurred after the development of cars and their road layout was often centrally planned using geometric grids.

But while the differences are stark to any human observer, nobody has succeeded in finding an objective way to capture the difference. Today, that changes thanks to the work of Rémi Louf and Marc Barthelemy at the Institut de Physique Théorique about 20 kilometers south of Paris. They have found a way to capture the unique "fingerprint" of a city's road layout and provide a way to classify and compare the unique layouts of cities all over the world for the first time.

Louf and Barthelemy began by downloading the road layouts from OpenStreetMap for 131 cities from all continents other than Antarctica.One objective way to assess road layout is to think of it as a network in which the nodes are junctions and road segments are the links in between.

The problem with this method is that the networks of most cities turn out to be remarkably similar. That's because the topology captures the connectedness of a city but nothing about the scale or geometry of the layout. It is the scale and geometry of the layout that seem to be the crucial difference between cities that humans recognize.

Louf and Barthelemy's breakthrough was to find a way of capturing this difference. Instead of examining the road layout, they look at the shapes of the spaces bounded by roads. In other words, they analyze the size and shape of the street blocks.

In a city based on a grid, these blocks will be mostly square or rectangular. But when the street layout is less regular, these blocks can be a variety of polygons.

Capturing the geometry of city blocks is tricky. However, Louf and Barthelemy do this using the ratio of a block's area to the area of a circle that encloses it. This quantity is always less than 1 and the smaller its value, the more exotic and extended the shape. The researchers then plot the distribution of block shapes for a given city.

But this shape distribution by itself is not enough to account for visual similarities and dissimilarities between street patterns. Louf and Barthelemy point out that New York and Tokyo share similar shape distributions but the visual similarity between these cities' layouts is far from obvious.

That's because blocks can have similar shapes but very different areas. "If two cities have blocks of the same shape in the same proportion but with totally different areas, they will look different," they say.

So the crucial measure that characterizes a city combines both the shape of the blocks and their area. To display this, Louf and Barthelemy arrange the blocks according to their area along the Y-axis and their shape ratio along the X-axis. The resulting plot is the unique fingerprint that characterizes each city.

When they did this for each of the 131 cities they had data for, they discovered that cities fall into four main types (see diagram above). The first category contains only one city, Buenos Aires in Argentina, which is entirely different from every other city in the database. Its blocks are all medium-size squares and regular rectangles.

October 28, 2014

Who's who in big data: companies, segments, niches

The
state of big data in 2014
, in a chart.

Via Matt Turck, 2014/05/11.

July 1, 2014

More data for health insurance: shopping habits

The Pittsburgh health plan, for instance, has developed prediction models that analyze data like patient claims, prescriptions and census records to determine which members are likely to use the most emergency and urgent care, which can be expensive. Data sets of past health care consumption are fairly standard tools for predicting future use of health services.

But the insurer recently bolstered its forecasting models with details on members' household incomes, education levels, marital status, race or ethnicity, number of children at home, number of cars and so on. One of the sources for the consumer data U.P.M.C. used was Acxiom, a marketing analytics company that obtains consumers' information from both public records and private sources.

With the addition of these household details, the insurer turned up a few unexpected correlations: Mail-order shoppers and Internet users, for example, were likelier than some other members to use more emergency services.

Of course, buying furniture through, say, the Ikea catalog is unlikely to send you to the emergency-room. But it could be a proxy for other factors that do have a bearing on whether you seek urgent care, says Pamela Peele, the chief analytics officer for the U.P.M.C. insurance services division. A hypothetical patient might be a catalog shopper, for instance, because he or she is homebound or doesn't have access to transportation.

"It brings me another layer of vision, of view, that helps me figure out better prediction models and allocate our clinical resources," Dr. Peele said during a recent interview. She added: "If you are going to decrease the costs and improve the quality of care, you have to do something different."

The U.P.M.C. health plan has not yet acted on the correlations it found in the household data. But it already segments its members into different "market baskets," based on analysis of more traditional data sets. Then it assigns care coordinators to certain members flagged as high risk because they have chronic conditions that aren't being properly treated. The goal, Dr. Peel

Continue reading "More data for health insurance: shopping habits " »

June 25, 2014

CrossValidated

http://stats.stackexchange.com is apparenlty home to Cross Validated, statistics help and seeking help fora at stackexchange.com .

May 22, 2014

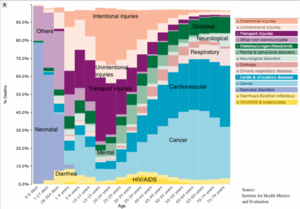
Death becomes all by cause

Cause vs age, via Institute for Health Metrics and Evaluation.

death_by_cause_medium.png

March 11, 2014

Metropolismag Big-Data-Big-Questions

"The old city of concrete, glass, and steel now conceals a vast underworld of computers and software," writes Anthony M. Townsend in Smart Cities: Big Data, Civic Hackers, and the Quest for the New Utopia (W. W. Norton & Company, 2013), perhaps the best book written on the phenomenon. "Not since the laying of water mains, sewage pipes, subway tracks, telephone lines, and electrical cables over a century ago have we installed such a vast and versatile new infrastructure for controlling the physical world."

February 25, 2014

Better track geography and know where stories are being published and talked about

Going forward, this study provides an interesting foundation for thinking about how our media are interrelated, and how various facts, anecdotes, and bits of misinformation make their way to the public.

"Can we start exploring the data not from identifying these topics of keywords upfront, but asking an algorithm to surface some of those for us?" asks Graeff. "What are some unusual things or clusters of news stories that will allow us to get a sense of news stories that otherwise wouldn't be seen?"

In the future, Graeff says he'd like to be able to better track geography and know where stories are being published and talked about. The team is also interested in using natural language processing to track the spread of quotations from source to source. In addition, "automated coding and sentiment analysis" could be used to better understand how perspectives in the newsroom are molding stories -- tools like OpenGender Tracker.

Ultimately, the goal is to create a suite of tools that activists, journalists, and academics can learn from. Says Graeff: "A lot of what we show here is that there are better methods for studying the media as a so-called media ecosystem that allow us to really understand how a story goes from barely a blip to a major national/international news event, and how controversies circle around that."

February 23, 2014

Most influential sources in the media

Media Cloud was used by Harvard's Yochai Benkler, one of its designers, to track media coverage of the SOPA-PIPA debate and to map that controversy via links throughout the media ecosystem. Benkler found that digital media like Reddit, Techdirt, and AmericanCensorship.org "were the most influential sources in the media ecosystem as ranked by incoming links, overshadowing the impact of traditional media sources." But as the authors point out, Benkler's subject matter was inherently Internet-centric; with this paper, they sought to repeat the controversy mapping on a less natively digital subject.

Continue reading "Most influential sources in the media " »

February 22, 2014

Online ratings: biased or manipulated ?

Online ratings are one of the most trusted sources of consumer confidence in e-commerce decisions. But recent research suggests that they are systematically biased and easily manipulated.

-- Sinan Aral, the David Austin Professor of Management and an associate professor of information technology and marketing at the MIT Sloan School of Management.

Continue reading "Online ratings: biased or manipulated ?" »

August 25, 2013

The prejudiced computer


The prejudiced computer

For one British university, what began as a time-saving exercise ended in disgrace when a computer model set up to streamline its admissions process exposed - and then exacerbated - gender and racial discrimination.

As detailed here in the British Medical Journal, staff at St George's Hospital Medical School decided to write an algorithm that would automate the first round of its admissions process. The formulae used historical patterns in the characteristics of candidates whose applications were traditionally rejected to filter out new candidates whose profiles matched those of the least successful applicants.

By 1979 the list of candidates selected by the algorithms was a 90-95% match for those chosen by the selection panel, and in 1982 it was decided that the whole initial stage of the admissions process would be handled by the model. Candidates were assigned a score without their applications having passed a single human pair of eyes, and this score was used to determine whether or not they would be interviewed.

Quite aside from the obvious concerns that a student would have upon finding out a computer was rejecting their application, a more disturbing discovery was made. The admissions data that was used to define the model's outputs showed bias against females and people with non-European-looking names.

The truth was discovered by two professors at St George's, and the university co-operated fully with an inquiry by the Commission for Racial Equality, both taking steps to ensure the same would not happen again and contacting applicants who had been unfairly screened out, in some cases even offering them a place.

Nevertheless, the story is just one well documented case of what could be thousands. At the time, St George's actually admitted a higher proportion of ethnic minority students than the average across London, although whether the bias shown by other medical schools was the result of human or machine prejudice is not clear.

July 1, 2013

Prosecutors' fallacy sampling and odds


To see why, suppose that police pick up a suspect and match his or her DNA to evidence collected at a crime scene. Suppose that the likelihood of a match, purely by chance, is only 1 in 10,000. Is this also the chance that they are innocent? It's easy to make this leap, but you shouldn't.

Here's why. Suppose the city in which the person lives has 500,000 adult inhabitants. Given the 1 in 10,000 likelihood of a random DNA match, you'd expect that about 50 people in the city would have DNA that also matches the sample. So the suspect is only 1 of 50 people who could have been at the crime scene. Based on the DNA evidence only, the person is almost certainly innocent, not certainly guilty.

This kind of error is so subtle that the untrained human mind doesn't deal with it very well, and worse yet, usually cannot even recognize its own inability to do so. Unfortunately, this leads to serious consequences, as the case of Lucia de Berk illustrates. Worse yet, our strong illusion of certainty in such matters can also lead to the systematic suppression of doubt, another shortcoming of the de Berk case.

Continue reading "Prosecutors' fallacy sampling and odds" »

May 10, 2013

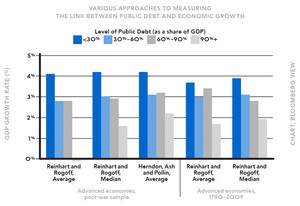
Reinhart and Rogoff's critics agree: more debt, slower growth


How should we aggregate the data into an informative bottom line? To Reinhart and Rogoff's critics, the natural approach is to take the average for each debt level across all years in all countries. This would, for example, give a country with 10 years of very high debt 10 times the weight of a country with only one year. Instead, Reinhart and Rogoff took an average growth rate for each country experiencing very high debt, then calculated the average across countries. In their approach, all countries with any experience of very high debt get the same weight.

Which approach makes more sense? That depends on the question you want to answer. Reinhart and Rogoff are trying to find the average country's growth rate during episodes of very high debt. Their critics are seeking the average growth rate of GDP when debt is very high. These are subtly different.

RR_90pct_barchart.jpg


From a statistical perspective, your preference might depend on your judgment about what drives differences in economic growth at a given level of debt. If you think broad country characteristics such as geography or quality of governance are the most important, you might choose Reinhart and Rogoff's approach of averaging out the national idiosyncrasies to determine the experience of the "typical country." If you believe that country and time-specific factors such as domestic- policy decisions matter most, then you might want to weight all years equally to average out these one-time influences.


Betsey Stevenson and Justin Wolfers

April 28, 2013

Understanding of Information Uncertainty and the Cost of Capital

Uncertainty and the Oil Fields

The reason for the review is that an Australian scholar has recently published a paper offering "A Bayesian Understanding of Information Uncertainty and the Cost of Capital." The gist of it is that traders face information uncertainty, that is, the risk of a misleading signal about the value of an asset.

"The Bayesian position," says D.J. Johnstone of the University of Sydney Business School, "is that even a highly informative signal ... can bring an increase in uncertainty, and hence an increase in the cost of capital." This is at least somewhat counter-intuitive. Surely the highly informative signals (also known as "greater transparency") will lessen uncertainty and risk, thus reducing the cost of capital.

Ah, Johnstone says, perhaps not. Consider a world in which there are two possible geological formations involved in the search for oil: A and B. There may be oil under either plot. Geologists tell us that plot A belongs to a type of geological formation with a 0.5 frequency of oil. B-type plots, on the other hand, have a 0.95 frequency of oil. It isn't always obvious which is which, and oil companies like to figure out which is which before making the final decisive test to determine whether there is oil there.

Suppose also that the prior probability of oil under a random site, before we even know if the site is A or B, is 0.635.

Now, on Day 1, an oil company owns a piece of land that has not yet been tested for oil, or even tested to determine whether it is A or B. The market will presumably assess the value of this land accordingly. Prospective buyers will consider it as having a 0.635 likelihood of bearing oil.

On Day 2, the land is tested and found to be of Type A.

Thereafter, the market will lower the value of that land, because its likelihood of bearing oil has fallen to 0.5. There is greater uncertainty post-test than there was pre-test.

Continue reading "Understanding of Information Uncertainty and the Cost of Capital" »

April 9, 2013

Big data to win elections


"The trickiest problem, the one that will take the longest time to solve, is the creation of a culture of data and analytics, including training operatives to understand what data is," Lundry said. And the collaborative nature of "data ecosystems," he suggested, do not play to Republican strengths.

The Priebus report surveyed 227 Republican campaign managers, field staff, consultants, vendors and other political professionals, asking them to rank the Democrat and Republican advantages on 24 different measures using a scale ranging from plus 5 (decisive Republican edge) to minus 5 (solid Democratic advantage). "Democrats," the report noted, "were seen as having the advantage on all but one." As the graph on Page 28 of the report illustrates, most of the largest Democratic advantages relate directly to the integration of technology with "ground war" campaign activities like person-to-person voter contact, election-day turnout and demographic analysis:

The premier pro-Democratic quantitatively oriented organizations -- both for-profit and nonprofit -- have become crucial sources of data, voter contact and nanotargeting innovation for Democrats and liberal organizations. These include:

• Catalist, which maintains a "comprehensive database of voting-age Americans" for progressive organizations;

• The Analyst Institute, "a clearinghouse for evidence-based best practices in progressive voter contact," which conducts experimental, randomized testing of voter persuasion and voter mobilization programs;

• TargetSmart Communications, which develops political and technology strategies;

• American Bridge 21st Century, which conducts year-round opposition research on Republicans and conservative groups;

• The Atlas Project, which provides clients with online access to detailed political history from national to local races, including media buys and campaign finance data and a host of other politically relevant data;

• Blue State Digital, a commercial firm founded by operatives in Howard Dean's 2004 campaign that now provides digital services to clients ranging from the Obama campaign to Ford Motor Company to Google.

Continue reading "Big data to win elections" »

March 28, 2013

Unlocking the Value of Personal Data: From Collection to Usage


The World Economic Forum published a report late last month that offered one path -- one that leans heavily on technology to protect privacy. The report grew out of a series of workshops on privacy held over the last year, sponsored by the forum and attended by government officials and privacy advocates, as well as business executives. The corporate members, more than others, shaped the final document.

The report, "Unlocking the Value of Personal Data: From Collection to Usage," recommends a major shift in the focus of regulation toward restricting the use of data. Curbs on the use of personal data, combined with new technological options, can give individuals control of their own information, according to the report, while permitting important data assets to flow relatively freely.

"There's no bad data, only bad uses of data," says Craig Mundie, a senior adviser at Microsoft, who worked on the position paper.

The report contains echoes of earlier times. The Fair Credit Reporting Act, passed in 1970, was the main response to the mainframe privacy challenge. The law permitted the collection of personal financial information by the credit bureaus, but restricted its use mainly to three areas: credit, insurance and employment.

Continue reading "Unlocking the Value of Personal Data: From Collection to Usage" »

March 26, 2013

Caffeine May Boost Driver Safety


The researchers interviewed all the drivers, gathering information about various health and lifestyle issues, including caffeine consumption over the past month. The study was published online in BMJ.

After adjusting for age, driver experience, distance driven, hours of sleep, naps, night driving and other factors, they found that drivers who consumed caffeine were 63 percent less likely to be involved in a crash.

Results Forty three percent of drivers reported consuming substances containing caffeine, such as tea, coffee, caffeine tablets, or energy drinks for the express purpose of staying awake. Only 3% reported using illegal stimulants such as amphetamine ("speed"); 3,4 methylenedioxymethamphetamine (ecstasy); and cocaine. After adjustment for potential confounders, drivers who consumed caffeinated substances for this purpose had a 63% reduced likelihood of crashing (odds ratio 0.37, 95% confidence interval 0.27 to 0.50) compared with drivers who did not take caffeinated substances.

According to the lead author, Lisa N. Sharwood, a research fellow at the George Institute for Global Health in Sydney, Australia, this does not mean that caffeinated drinks are the answer for road safety.

Continue reading "Caffeine May Boost Driver Safety" »

March 17, 2013

Afirmative action 2


WHAT'S more important to how your life turns out: the prestige of the school you attend or how much you learn while you're there? Does the answer to this question change if you are the recipient of affirmative action?

From school admissions to hiring, affirmative action policies attempt to compensate for this country's brutal history of racial discrimination by giving some minority applicants a leg up. This spring the Supreme Court will decide the latest affirmative action case, weighing in on the issue for the first time in 10 years.

Scholars began referring to this theory as "mismatch." It's the idea that affirmative action can harm those it's supposed to help by placing them at schools in which they fall below the median level of ability and therefore have a tough time. As a consequence, the argument goes, these students suffer learningwise and, later, careerwise. To be clear, mismatch theory does not allege that minority students should not attend elite universities. Far from it. But it does say that students -- minority or otherwise -- do not automatically benefit from attending a school that they enter with academic qualifications well below the median level of their classmates.

Data presented a plausible opportunity to gauge mismatch. The fact that 689 black students got into their first-choice law school meant that all 689 were similar in at least that one regard (though possibly dissimilar in many other ways). If mismatch theory held any water, then the 177 students who voluntarily opted for their second-choice school -- and were therefore theoretically better "matched" -- could be expected, on average, to have better outcomes on the bar exam than their peers who chose the more elite school. Mr. Sander's analysis of the B.P.S. data found that 21 percent of the black students who went to their second-choice schools failed the bar on their first attempt, compared with 34 percent of those who went to their first choice.

The experiment is far from ideal. Mismatch opponents argue that there are many unobservable differences between second-choice and first-choice students and that those differences, because they're unknown, cannot be accounted for in a formula. In the case of the B.P.S. data, maybe the second-choice students tended to have undergraduate majors that made them particularly well suited to flourish in the classroom and on the bar, regardless of which law school they attended. "All this work on mismatch assumes you know enough to write an algebraic expression that captures what's really going on," says Richard A. Berk, a professor of criminology and statistics at the University of Pennsylvania. "Here, there's so much we don't know. Besides, the LSAT is a very imperfect measure of performance in law school and thereafter, as is the bar exam."

Daniel E. Ho, a law professor at Stanford, also disputes the mismatch hypothesis. In a response to Mr. Sander's 2005 law review article, Mr. Ho wrote in the Yale Law Journal that "black law students who are similarly qualified when applying to law school perform equally well on the bar irrespective of what tier school they attend."

Continue reading "Afirmative action 2" »

February 18, 2013

Acting like test preparation invalidates inferences that can be drawn" about children's "learning potential and intellect and achievement


Assessing students has always been a fraught process, especially 4-year-olds, a mercurial and unpredictable lot by nature, who are vying for increasingly precious seats in kindergarten gifted programs.

In New York, it has now become an endless contest in which administrators seeking authentic measures of intelligence are barely able to keep ahead of companies whose aim is to bring out the genius in every young child.


Hunter, a public school for gifted children that is part of the City University of New York, requires applicants to take the Stanford-Binet V intelligence test, and until last year, families could pick from 1 of 16 psychologists to administer the test. Uncovering who was the "best tester," one who might give children more time to answer, or pose questions different ways, was a popular parlor game among parents.

The city's leading private schools are even considering doing away with the test they have used for decades, popularly known as the E.R.B., after the Educational Records Bureau, the organization that administers the exam, which is written by Pearson.

"It's something the schools know has been corrupted," said Dr. Samuel J. Meisels, an early-childhood education expert who gave a presentation in the fall to private school officials, encouraging them to abandon the test. Excessive test preparation, he said, "invalidates inferences that can be drawn" about children's "learning potential and intellect and achievement."

Last year, the Education Department said it would change one of the tests used for admission to public school gifted kindergarten and first-grade classes in order to focus more on cognitive ability and less on school readiness, which favors children who have more access to preschool and tutoring.

Continue reading "Acting like test preparation invalidates inferences that can be drawn" about children's "learning potential and intellect and achievement" »

November 22, 2012

Survival rates are higher when measured earlier


Survival rates always go up with early diagnosis: people who get a diagnosis earlier in life will live longer with their diagnosis, even if it doesn't change their time of death by one iota.

-- H. Gilbert Welch, professor of medicine at the Dartmouth Institute for Health Policy and Clinical Practice and an author of "Overdiagnosed: Making People Sick in the Pursuit of Health."

Continue reading "Survival rates are higher when measured earlier" »

October 25, 2012

Mandelbrot, "The Fractalist"

"I realized that mathematics cut off from the mysteries of the real world was not for me, so I took a different path," he writes. He wanted to play with what he calls "questions once reserved for poets and children."

He prized roughness and complication. "Think of color, pitch, loudness, heaviness and hotness," he once said. "Each is the topic of a branch of physics." He dedicated his life to studying roughness and irregularity through geometry, applying what he learned to biology, physics, finance and many other fields.

He was never easy to pin down. He hopscotched so frequently among disciplines and institutions -- I.B.M., Yale, Harvard -- that in his new memoir, "The Fractalist," he rather plaintively asks, "So where do I really belong?" The answer is: nearly everywhere.

As "The Fractalist" makes plain, Mandelbrot led a zigzag sort of life, rarely remaining in one place for long. He was born in Warsaw to a middle-class Lithuanian Jewish family that prized intellectual achievement. His mother was a dentist; his father worked in the clothing business. Both loved knowledge and ideas, and their relatives included many fiercely brainy men.

Continue reading "Mandelbrot, "The Fractalist" " »

October 17, 2012

Complexity at discrete.gr


Complexity analysis is also a tool that allows us to explain how an algorithm behaves as the input grows larger. If we feed it a different input, how will the algorithm behave? If our algorithm takes 1 second to run for an input of size 1000, how will it behave if I double the input size? Will it run just as fast, half as fast, or four times slower? In practical programming, this is important as it allows us to predict how our algorithm will behave when the input data becomes larger. discrete.gr/complexity/.

September 18, 2012

Scaling campaign contributors on a "liberal-conservative"


Stanford political scientist Adam Bonica has done terrific work mining public campaign donation records for insights into the behavior of campaign contributors. Using a scaling algorithm similar in flavor to those often applied to congressional roll call votes, he has mapped more than 50,000 candidates for federal and state offices and more than 11 million distinct campaign contributors on a "liberal-conservative" dimension.

September 11, 2012

Amazon 2011


New features abound, of course, but they're the sort that university teachers and other white-collar workers know all too well: ways of doing more with less, by making workers (or customers) handle the routine chores that used to be done for them. Nowadays you can tag a given "product" for Amazon so that it knows what you think of a book; if you want, you can even study a tag cloud that lists and ranks the most popular customer tags, so that you'll do a better job of tagging for the company. You can enter a customer discussion or post a review.

And, of course, whenever you buy a book, you help Amazon not only gauge the book's popularity, but also identify the other books that you have bought as well. It's an efficient, thoroughly commercial counterpart to the old information system. The simple, elegant Web page that once showered discriminating customers with information now invites the consumer to provide information of every sort for Amazon to digest and profit from.

Continue reading "Amazon 2011" »

September 1, 2012

Claudia Perlich, some machine modlelling links


Claudia Perlich mines and models data with machines:

"Leakage in Data Mining: Formulation, Detection, and Avoidance"
S. Kaufman, S. Rosset, C. Perlich, O. Stitelman. Forthcoming in Transactions on Knowledge Discovery from Data

"On Cross-Validation and Stacking: Building Seemingly Predictive Models on Random Data"
Claudia Perlich, Grzegorz Swirszcz. SIGKDD Explorations 12(2) (2010) 11-15

"Ranking-Based Evaluation of Regression Models"
Rosset, S., C. Perlich, and B. Zadrozny, Knowledge and Information Systems 12 (3) 2006 331-329

"Tree Induction vs. Logistic Regression: A Learning Curve Analysis"
Perlich, C., F. Provost, and J. Simonoff. Journal of Machine Learning Research 4 (2003) 211-255

August 28, 2012

Robots score essays well


the William and Flora Hewlett Foundation sponsored a competition to see how well algorithms submitted by professional data scientists and amateur statistics wizards could predict the scores assigned by human graders. The winners were announced last month -- and the predictive algorithms were eerily accurate.

The competition was hosted by Kaggle, a Web site that runs predictive-modeling contests for client organizations -- thus giving them the benefit of a global crowd of data scientists working on their behalf. The site says it "has never failed to outperform a pre-existing accuracy benchmark, and to do so resoundingly."

Kaggle's tagline is "We're making data science a sport." Some of its clients offer sizable prizes in exchange for the intellectual property used in the winning models. For example, the Heritage Health Prize ("Identify patients who will be admitted to a hospital within the next year, using historical claims data") will bestow $3 million on the team that develops the best algorithm.

The essay-scoring competition that just concluded offered a mere $60,000 as a first prize, but it drew 159 teams. At the same time, the Hewlett Foundation sponsored a study of automated essay-scoring engines now offered by commercial vendors. The researchers found that these produced scores effectively identical to those of human graders.

Barbara Chow, education program director at the Hewlett Foundation, says: "We had heard the claim that the machine algorithms are as good as human graders, but we wanted to create a neutral and fair platform to assess the various claims of the vendors. It turns out the claims are not hype."

-- Randall Stross.

Continue reading "Robots score essays well" »

July 3, 2012

Employment discrimination provisions


An employer's evidence of a racially balanced workforce will not be enough to disprove disparate impact.

Employment discrimination provisions of the act apply to companies with more than 15 employees and define two broad types of discrimination, disparate treatment and disparate impact. Disparate treatment is fairly straightforward: It is illegal to treat someone differently on the basis of race or national origin.

For example, an employer cannot refuse to hire an African-American with a criminal conviction but hire a similarly situated white person with a comparable conviction.

Disparate impact is more complicated. It essentially means that practices that disproportionately harm racial or ethnic groups protected by the law can be considered discriminatory even if there is no obvious intent to discriminate. In fact, according to the guidance, "evidence of a racially balanced work force will not be enough to disprove disparate impact."

EEOC: 1, 2.


July 1, 2012

Axciom, data refinery


A bank that wants to sell its best customers additional services, for example, might buy details about those customers' social media, Web and mobile habits to identify more efficient ways to market to them. Or, says Mr. Frankland at Forrester, a sporting goods chain whose best customers are 25- to 34-year-old men living near mountains or beaches could buy a list of a million other people with the same characteristics. The retailer could hire Acxiom, he says, to manage a campaign aimed at that new group, testing how factors like consumers' locations or sports preferences affect responses.

But the catalog also offers delicate information that has set off alarm bells among some privacy advocates, who worry about the potential for misuse by third parties that could take aim at vulnerable groups. Such information includes consumers' interests -- derived, the catalog says, "from actual purchases and self-reported surveys" -- like "Christian families," "Dieting/Weight Loss," "Gaming-Casino," "Money Seekers" and "Smoking/Tobacco." Acxiom also sells data about an individual's race, ethnicity and country of origin. "Our Race model," the catalog says, "provides information on the major racial category: Caucasians, Hispanics, African-Americans, or Asians." Competing companies sell similar data.

Acxiom's data about race or ethnicity is "used for engaging those communities for marketing purposes," said Ms. Barrett Glasgow, the privacy officer, in an e-mail response to questions.

There may be a legitimate commercial need for some businesses, like ethnic restaurants, to know the race or ethnicity of consumers, says Joel R. Reidenberg, a privacy expert and a professor at the Fordham Law School.

"At the same time, this is ethnic profiling," he says. "The people on this list, they are being sold based on their ethnic stereotypes. There is a very strong citizen's right to have a veto over the commodification of their profile."

He says the sale of such data is troubling because race coding may be incorrect. And even if a data broker has correct information, a person may not want to be marketed to based on race.

"DO you really know your customers?" Acxiom asks in marketing materials for its shopper recognition system, a program that uses ZIP codes to help retailers confirm consumers' identities -- without asking their permission.

"Simply asking for name and address information poses many challenges: transcription errors, increased checkout time and, worse yet, losing customers who feel that you're invading their privacy," Acxiom's fact sheet explains. In its system, a store clerk need only "capture the shopper's name from a check or third-party credit card at the point of sale and then ask for the shopper's ZIP code or telephone number." With that data Acxiom can identify shoppers within a 10 percent margin of error, it says, enabling stores to reward their best customers with special offers. Other companies offer similar services.

"This is a direct way of circumventing people's concerns about privacy," says Mr. Chester of the Center for Digital Democracy.
June 9, 2012

SAS financial services modeling


The SAS financial services modeling group in San Diego, exploring ways they can take advantage of high-performance analytics and big data techniques to deliver more models, more quickly, and to more customers. This wasn't completely an academic exercise--the team in San Diego has added several new customers recently and have been looking for ways to boost productivity, so this is the perfect setup for our high-performance story. Perhaps you've seen Jim Davis' blog where he ponders what you can do with all the extra time savings that high-performance analytics offers ... provide service to more customers is one good idea!

June 4, 2012

Fab, post Fabulis, is data driven


Custora, which also works with sites like Etsy and Revolve Clothing, creates similar online dashboards. But its specialty is identifying the most valuable customer segments and using algorithms to forecast their potential spending over time. Right now, for example, only 15 percent of Fab.com purchasers shop with the company's iPad app. But a Custora forecast estimated that, over the next two years, a typical iPad customer would spend twice as much as a typical Web customer and that the iPad cohort would generate more than 25 percent of Fab.com's revenue.

In an era of online behavioral tracking, Fab.com has been more transparent than some other sites about a lot of its customer surveillance, data collection and analysis. Mr. Goldberg writes regularly about the company's social marketing practices and metrics on his blog. Likewise, when Fab.com was seeking seed money last year, Mr. Goldberg gave several venture capital firms passwords to the RJMetrics' dashboard so they could see the company's revenue and customer trends for themselves.

"V.C.'s could see it every day," he says. "They could come back and say, 'How did Fab do today?' "

Last December, Fab raised $40 million from Andreessen Horowitz, Menlo Ventures, First Round Capital and several other sources, including the actor Ashton Kutcher. Mr. Goldberg, meanwhile, is now an investor in and a board member at RJMetrics.

THIS month, the site even re-engineered its look -- to Fab 3.0 (post Fabulis)-- to capitalize on recent data indicating that users who had checked out the site's crowd-sourcing feature were more likely to make purchases than those who had not. Among other updates, the site now gives more prominence to a live feed featuring the products that members have just bought or liked.

Continue reading "Fab, post Fabulis, is data driven" »

May 14, 2012

Quantified-Self


Footsteps, sweat, caffeine, memories, stress, even sex and dating habits - it can all be calculated and scored like a baseball batting average. And if there isn't already an app or a device for tracking it, one will probably appear in the next few years.

Over the last weekend of May, in the upstairs of the Computer History Museum in Mountain View, California, in the heart of Silicon Valley, 400 "Quantified-Selfers" from around the globe have gathered to show off their Excel sheets, databases and gadgets.

-- April Dembosky, FT's San Francisco correspondent


Continue reading "Quantified-Self" »

April 19, 2012

Cybercrime: overcounted, and as tradegy of the commons


Most cybercrime estimates are based on surveys of consumers and companies. They borrow credibility from election polls, which we have learned to trust. However, when extrapolating from a surveyed group to the overall population, there is an enormous difference between preference questions (which are used in election polls) and numerical questions (as in cybercrime surveys).

For one thing, in numeric surveys, errors are almost always upward: since the amounts of estimated losses must be positive, there's no limit on the upside, but zero is a hard limit on the downside. As a consequence, respondent errors -- or outright lies -- cannot be canceled out. Even worse, errors get amplified when researchers scale between the survey group and the overall population.

Suppose we asked 5,000 people to report their cybercrime losses, which we will then extrapolate over a population of 200 million. Every dollar claimed gets multiplied by 40,000. A single individual who falsely claims $25,000 in losses adds a spurious $1 billion to the estimate. And since no one can claim negative losses, the error can't be canceled.

THE cybercrime surveys we have examined exhibit exactly this pattern of enormous, unverified outliers dominating the data. In some, 90 percent of the estimate appears to come from the answers of one or two individuals. In a 2006 survey of identity theft by the Federal Trade Commission, two respondents gave answers that would have added $37 billion to the estimate, dwarfing that of all other respondents combined.

This is not simply a failure to achieve perfection or a matter of a few percentage points; it is the rule, rather than the exception. Among dozens of surveys, from security vendors, industry analysts and government agencies, we have not found one that appears free of this upward bias. As a result, we have very little idea of the size of cybercrime losses.

-- Dinei Florêncio is a researcher and Cormac Herley, Microsoft Research.

Continue reading "Cybercrime: overcounted, and as tradegy of the commons" »

April 4, 2012

Matching algorithms


Other sites are trying to move past the algorithm. A start-up called myMatchmaker uses in-the-flesh people as intermediaries. Some, like Nerve.com, and How About We, aim to streamline the process and encourage interactions around more than a profile.

But Kevin Slavin, a game developer who studies algorithms, says those sites are already starting from a flawed base.

The digital personas we cultivate on Facebook are often not very indicative of who we are, he said. "A first date is the most tangible instance of you being the best possible version of yourself, the version you think will be the most attractive to someone else," he said. "It is impossible for that to be the same person on Facebook."

Rob Fishman, who helmed the development of Yoke.me, says he views the service as an icebreaker, not as a crystal ball capable of divining whether or not someone is your one true love. "We aren't saying you will want to spend your life together; you don't even know each other yet," he said. "You like the same band, talk amongst yourselves."

Continue reading "Matching algorithms" »

December 26, 2011

Optimizing resume for keyword scanners


It's more than just single keywords that make you stand out from the crowd:

After all, a lot of other people are making sure that their resumes mimic the words mentioned in job descriptions as well. Instead, Lifehacker suggests that many companies now look for semantic matches, which are related terms like CPA, accounting, audits, and SEC to ensure that your resume represents real-world, useful, and related experience rather than just being stuffed with keywords. For an example of how this works, check out Monster.com's Power Resume Search Test Drive.

-- CBS

October 10, 2011

Akka, Redis, Riak, Git, Chef, and Scala are tools of today


Skills and Tools

We're pragmatists. We have no religion about development process, programming languages, version control, text editors, SQL vs NoSQL, etc. We use the right tool for the job, and we try to stay adaptable and open-minded. We care deeply about building a mutually supportive atmosphere, and you should, too.

We don't expect everyone we hire to be an expert in everything we do on their first day. We do expect that you want to learn, grow, and be challenged by the people you work with. You should be able to learn new things on your own, quickly.

We believe strongly in metrics, testing, continuous integration, and working fluidly and harmoniously with our experienced operations staff. Everything we write is designed for simplicity and maintainability. We take security very, very seriously.

Our backend developers mostly work in Scala. Our frontend developers mostly work in Ruby and JavaScript. We use Git, Chef, a variety of Amazon Web Services, Postgres, and more. We're experimenting with Akka, Redis, Riak, and other neat stuff, but always with a critical eye and thorough benchmarking.

We are active open source contributors, and we hope that you are too (or, at least, that you want to be).

Continue reading "Akka, Redis, Riak, Git, Chef, and Scala are tools of today" »

September 23, 2011

Optimal number and locations of fire stations, by RAND


Take the 1968 decision by New York Mayor John V. Lindsay to hire the RAND Corporation to streamline city management through computer models. It built models for the Fire Department to predict where fires were likely to break out, and to decrease response times when they did. But, as the author Joe Flood details in his book "The Fires," thanks to faulty data and flawed assumptions -- not a lack of processing power -- the models recommended replacing busy fire companies across Brooklyn, Queens and the Bronx with much smaller ones.

What RAND could not predict was that, as a result, roughly 600,000 people in the poorest sections of the city would lose their homes to fire over the next decade. Given the amount of money and faith the city had put into its models, it's no surprise that instead of admitting their flaws, city planners bent reality to fit their models -- ignoring traffic conditions, fire companies' battling multiple blazes and any outliers in their data.

The final straw was politics, the very thing the project was meant to avoid. RAND's analysts recognized that wealthy neighborhoods would never stand for a loss of service, so they were placed off limits, forcing poor ones to compete among themselves for scarce resources. What was sold as a model of efficiency and a mirror to reality was crippled by the biases of its creators, and no supercomputer could correct for that.

Continue reading "Optimal number and locations of fire stations, by RAND" »

July 8, 2011

Placebo effectivess impresses


When testing Abilify, how was it determined that is a placebo is no better than Abilify ?

fda_insidebox_oped-art-.jpg

The box would quantify the benefits and side effects of Abilify used in combination with other antidepressants, drawing on the larger of the two six-week trials that formed the basis of its approval by the F.D.A. First, it would show how the drug scored versus a placebo (in Abilify's case, not much: only three points lower on a 60-point scale, and it resolved depression for only 10 percent of patients -- that is, 25 percent with Abilify versus 15 percent with just the placebo).

Continue reading "Placebo effectivess impresses" »

May 5, 2011

Gender imbalance ? Counting athletes


Universities must demonstrate compliance with Title IX in at least one of three ways: by showing that the number of female athletes is in proportion to overall female enrollment, by demonstrating a history of expanding opportunities for women, or by proving that they are meeting the athletic interests and abilities of their female students.

After South Florida added more than 100 football players, it was out of balance under the first test. Lamar Daniel, a gender-equity consultant, told the university in 2002 that it failed the other two as well. He recommended adding a women's swimming team and warned that trying to comply with the proportionality option would be difficult because South Florida's female participation numbers were too low.

But university officials tried anyway. A primary strategy was to expand the women's running teams. Female runners can be a bonanza because a single athlete can be counted up to three times, as a member of the cross-country and the indoor and outdoor track teams.

In 2002, 21 South Florida women competed in cross-country. By 2008, the number had grown to 75 -- more than quadruple the size of an average Division I cross-country team.

When told of the team's size, Mr. Daniel, a former investigator for the Office for Civil Rights, said: "Good gracious. That would certainly justify further examination."

In 2009-10, South Florida reported 71 women on its cross-country team, but race results show only 28 competed in at least one race.

At a recent track meet at South Florida, three female long jumpers who are listed on the cross-country roster said they were not members of that team.

-- Karen Crouse, Griffin Palmer and Marjorie Connelly

Continue reading "Gender imbalance ? Counting athletes" »

April 17, 2011

A study that is statistically significant


"A study that is statistically significant has results that are unlikely
to be the result of random error . . . ." Federal Judicial Center, Refer­
ence Manual on Scientific Evidence 354 (2d ed. 2000). To test for
significance, a researcher develops a "null hypothesis"--e.g., the asser­
tion that there is no relationship between Zicam use and anosmia. See
id., at 122. The researcher then calculates the probability of obtaining
the observed data (or more extreme data) if the null hypothesis is true
(called the p-value). Ibid. Small p-values are evidence that the null
hypothesis is incorrect. See ibid. Finally, the researcher compares the
p-value to a preselected value called the significance level. Id., at 123.
If the p-value is below the preselected value, the difference is deemed
"significant." Id., at 124.

..

For the reasons just stated, the mere existence of
reports of adverse events--which says nothing in and of
itself about whether the drug is causing the adverse
events--will not satisfy this standard. Something more is
needed, but that something more is not limited to statisti­
cal significance and can come from "the source, content,
and context of the reports," supra, at 15. This contextual
inquiry may reveal in some cases that reasonable inves­
tors would have viewed reports of adverse events as mate­
rial even though the reports did not provide statistically
significant evidence of a causal link.

-- supremecourt.gov/opinions 09-1156

Continue reading "A study that is statistically significant " »

January 13, 2011

Management Science Thinking


1. Emphasize the elements of management science thinking
a. Reasoning with models
b. How to use data
c. Assumptions
d. Objectives, alternatives and constraints
e. Omnipresence of variability
f. Measuring and modeling variability

2. Incorporate more concepts, fewer recipes and derivations

3. Foster active learning through problem solving.

-- Matt Bailey, ORMS Today (2010 August)

June 14, 2010

Teachers caught cheating for students


In Georgia, the state school board ordered investigations of 191 schools in February after an analysis of 2009 reading and math tests suggested that educators had erased students' answers and penciled in correct responses. Computer scanners detected the erasures, and classrooms in which wrong-to-right erasures were far outside the statistical norm were flagged as suspicious.

The Georgia scandal is the most far-reaching in the country. It has already led to the referral of 11 teachers and administrators to a state agency with the power to revoke their licenses. More disciplinary referrals, including from a dozen Atlanta schools, are expected.

Continue reading "Teachers caught cheating for students" »

May 27, 2010

MTA transit data dump #MTADEV opens for development


#MTADEV: Build your own transit informatics for lower NY and NYC using MTA's data.

January 7, 2010

Theorists and practitioners of intelligence

Then, as now, theorists and practitioners of intelligence sought a smoothly functioning, highly efficient and seamlessly integrated organization, or cluster of organizations. But they struggled at it, largely because the purposes to which intelligence were put were complex and at times contradictory.

In his book "Cloak and Gown," published in 1987, the Yale historian Robin Winks pointed out, "The 'intelligence debate' was framed in 1949." That was the year a classic text, Sherman Kent's "Strategic Intelligence for American World Policy," came out.

To Kent, the best intelligence-gathering was the work "of devoted specialists molded into a vigorous production unit," who prized the arts of data accumulation and nonideological analysis.

Kent's book was widely adopted by intelligence services around the world. But it also had critics, among them the political scientist Willmoore Kendall, a onetime adviser to the C.I.A. He wrote that Kent's approach, influenced by the Pearl Harbor attack, betrayed "a compulsive preoccupation with prediction, with the elimination of 'surprise' from foreign affairs."

This was a worthy goal in wartime, Mr. Kendall said, but in peacetime the most useful intelligence provided the big "pictures" of the world that decision makers needed for formulating broad policy. Intelligence experts therefore should not just acquire and analyze information; they should interpret it as well.


Continue reading "Theorists and practitioners of intelligence " »

December 19, 2009

Weather out of bounds vs forecast

16 < 24

weather_nyt_2.png

December 15, 2009

Disparate treatment

Curiously does not mention which medicines are so prevelant.

New federally financed drug research reveals a stark disparity: children covered by Medicaid are given powerful antipsychotic medicines at a rate four times higher than children whose parents have private insurance. And the Medicaid children are more likely to receive the drugs for less severe conditions than their middle-class counterparts, the data shows.

Children and Antipsychotic Drugs Those findings, by a team from Rutgers and Columbia, are almost certain to add fuel to a long-running debate. Do too many children from poor families receive powerful psychiatric drugs not because they actually need them -- but because it is deemed the most efficient and cost-effective way to control health problems that may be handled much differently for middle-class children?


Continue reading "Disparate treatment" »

November 19, 2009

Wyatt Gallery is aptly named

Mr Wyatt Gallery has a Photography Gallery.

Notably, he received a Fulbright Scholarship to travel to Trinidad and Tobago.

-- another example of the Dennis the Dentist naming rule.

Continue reading "Wyatt Gallery is aptly named" »

October 18, 2009

De-anonymizing

For example, contestants in Netflix's competition to improve its recommendation software received a training data set containing the movie preferences of more than 480,000 customers who had, as they say in the trade, been "de-identified." But as part of a privacy experiment, a pair of computer scientists at the University of Texas at Austin decided to see if it was possible to re-identify those unnamed movie fans.

By comparing the film preferences of some anonymous Netflix customers with personal profiles on imdb.com, the Internet movie database, the researchers said they easily re-identified some people because they had posted their e-mail addresses or other distinguishing information online.

Continue reading "De-anonymizing" »

August 18, 2009

We model a zombie attack

Zombies are a popular figure in pop culture/entertainment and they are usually portrayed as being brought about through an outbreak or epidemic. Consequently, we model a zombie attack, using biological assumptions based on popular zombie movies. We introduce a basic model for zombie infection, determine equilibria and their stability, and illustrate the outcome with numerical solutions. We then refine the model to introduce a latent period of zombification, whereby humans are infected, but not infectious, before becoming undead. We then modify the model to include the effects of possible quarantine or a cure. Finally, we examine the impact of regular, impulsive reductions in the number of zombies and derive conditions under which eradication can occur. We show that only quick, aggressive attacks can stave off the doomsday scenario: the collapse of society as zombies overtake us all.

Abstract of a new paper in Infectious Disease Modelling Research Progress.

Continue reading "We model a zombie attack" »

August 3, 2009

SSPS, bought by IBM for $1.2 billion

I.B.M. took a big step to expand its fast-growing stable of data analysis offerings by agreeing on Tuesday to pay $1.2 billion to buy SPSS Inc., a maker of software used in statistical analysis and predictive modeling.

Other independent analytics software makers may well become takeover targets, said Mr. Evelson of Forrester. Among the candidates, he said, are Accelrys, Applied Predictive Technologies, Genalytics, InforSense, KXEN and ThinkAnalytics.

The broad consolidation wave in business intelligence software, analysts say, will bring increasing price pressure on some segments of the industry as major companies seek to increase their share of the market. And the open-source programming language for data analysis, R, is another source of price pressure on software suppliers.

"None of the consolidation purchases we've seen in the business intelligence industry have been fire sales," said Jim Davis, senior vice president of the SAS Institute, a private company based in Cary, N.C., that is the largest supplier of business intelligence and predictive analytics software.

Continue reading "SSPS, bought by IBM for $1.2 billion" »

April 16, 2009

Dennis the dentist, 3

The most astonishing change concerns the ending of boys' names. In 1880, most boys' names ended in the letters E, N, D and S. In 1956, the chart of final letters looked pretty much the same, with more names ending in Y. Today's chart looks nothing like the charts of the past century. In 2006, a huge (and I mean huge) percentage of boys' names ended in the letter N. Or as Wattenberg put it, "Ladies and gentlemen, that is a baby-naming revolution."

Wattenberg observes a new formality sweeping nursery schools. Thirty years ago there would have been a lot of Nicks, Toms and Bills on the playground. Now they are Nicholas, Thomas and William. In 1898, the name Dewey had its moment (you should be able to figure out why). Today, antique-sounding names are in vogue: Hannah, Abigail, Madeline, Caleb and Oliver.

In the late 19th century, parents sometimes named their kids after prestigious jobs, like King, Lawyer, Author and Admiral. Now, children are more likely to bear the names of obsolete proletarian professions, Cooper, Carter, Tyler and Mason.

Wattenberg uses her blog to raise vital questions, such as should you give your child an unusual name that is Googleable, or a conventional one that is harder to track? But what's most striking is the sheer variability of the trends she describes.

Naming fashion doesn't just move a little. It swings back and forth. People who haven't spent a nanosecond thinking about the letter K get swept up in a social contagion and suddenly they've got a Keisha and a Kody. They may think they're making an individual statement, but in fact their choices are shaped by the networks around them.

Furthermore, if you just looked at names, you would conclude that American culture once had a definable core -- signified by all those Anglo names like Mary, Robert, John and William. But over the past few decades, that Anglo core is harder to find. In the world of niche naming, there is no clearly identifiable mainstream.

Continue reading "Dennis the dentist, 3" »

April 6, 2009

Dennis the dentist rules

Still, the couple, like many others, is vulnerable to falling behind again as home prices decline further. But Robert M. Lawless, a law professor at the University of Illinois who favors cram-downs, said success should not be viewed simply "in terms of dollars and cents."

-- Lawless law professor on cramdowns.

Explanation of the Dennis the dentist rule.

November 25, 2008

Head hurt bayesian

They found that Web searches for things like headache and chest pain were just as likely or more likely to lead people to pages describing serious conditions as benign ones, even though the serious illnesses are much more rare.

For example, there were just as many results that linked headaches with brain tumors as with caffeine withdrawal, although the chance of having a brain tumor is infinitesimally small.

Would such inference be addressed better by a frequentist or bayesian mindset ?

Continue reading "Head hurt bayesian" »

October 16, 2007

Lost in lossy: compression loses information

Jpeg: image compression artifacts.

June 11, 2007

Cash back at closing -- Mortgage fraud ?

First he built a dictionary of 150 keywords in real estate
ads — “creative financing,” for instance — that might
signal a seller’s willingness to play loose. He then looked
for instances in which a house had languished on the
market and yet wound up selling at or even above the
final asking price. In such cases, he found that buyers
typically paid a very small down payment; the smaller
the down payment, in fact, the higher the price they
paid for the house. What could this mean?

Either the most highly leveraged buyers were terrible
bargainers — or, as Ben-David concluded, such anomalies
indicated the artificial inflation that marked a cash-back deal.

Having isolated the suspicious transactions in the data,
Ben-David could now examine the noteworthy traits they
shared. He found that a small group of real estate agents
were repeatedly involved, in particular when the seller was
himself an agent or when there was no second agent in the
deal. Ben-David also found that the suspect transactions
were more likely to occur when the lending bank, rather
than keeping the mortgage, bundled it up with thousands
of others and sold them off as mortgage-backed securities.

This suggests that the issuing banks treat suspect mortgages
with roughly the same care as you might treat a rental car,
knowing that you aren’t responsible for its long-term outcome
once it is out of your possession.

-- Freakonomic pf the week.

June 1, 2007

Epicurean Dealmaker

epicureandealmaker on fat tails.
Derivatives: Transfering risk or reducing risk ?

May 30, 2007

Interest-rate term-structure pricing models: Riccardo Rebonato

Review Paper. Interest-rate term-structure pricing models: a review
Riccardo Rebonato

Interest-rate term structure modelling from the early short-rate-based
models to the current developments; use models for pricing complex
derivatives or for relative-value option trading. Therefore, relative-pricing
models are given a greater emphasis than equilibrium models.

The current state of modelling owes a lot to how models have
historically developed in the industry, and stresses the importance
of 'technological' developments (such as faster computers or more
efficient Monte Carlo techniques) in guiding the direction of theoretical
research.

The importance of the joint practices of vega hedging and daily
model-recalibration is analysed in detail. The relevance of market
incompleteness and of the possible informational inefficiency of
derivatives markets for calibration and pricing is also discussed.

Continue reading "Interest-rate term-structure pricing models: Riccardo Rebonato" »

April 22, 2007

Susan Athey, econometrician, wins Clarke Medal

Susan Athey's applied econometrics and heterogeneity of mentorship
wins a Clarke medal, awarded to the most accomplished economist
nearing 40 and is the most distinguished prize short of a Nobel.
Bio.

March 17, 2007

NOAA vs the world

Paul K Greed asks about why the anomaly figure is
less worrisome than it seems:

1. All weather observers are safely far away from Iraq
2. It's still 72 F and sunny in La Jolla
3. America is still read, white and blue.

February 15, 2007

Prosper lending community

Prosper now enjoys some powerfu tools.

regression analysis forum
adverse selection says avoid the high rate borrowers.
Money Walks journal of patterns in data, performance.

Erics great survey or lenders: oustandings, return

Prosper Analytics animated charts, not quite chart junk. ROI.

P2P conventional loan analytics.

Prosper's own loan performance database.

February 6, 2007

Infosthetics

Infosthetics shows time trends.

January 24, 2007

Many Eyes interactive data visualization

Data visualization in web browser, with interaction.
New champion: IBM's Many Eyes.

Liked by JHeer and radar.oreilly.

January 20, 2007

Atrios's bookshelf

Atrios's bookshelf.
A former economist, indeed.

db_atrios_bookshelf_pj22.jpg

October 6, 2006

Visualization and segmentation: Gelman's bag of tricks

Visualization and segmentation: Gelman's

Bag of tricks
for teaching statistics.

.

See also Gelman's Data Analysis Using Regression and Multilevel/Hierarchical Models.

August 6, 2006

Hedging beyond duration and convexity

Hedging beyond duration and convexity.

By considering a representation using a Fourier-like harmonic,
empirical evidence that such a series provides our hedging
strategy on a mortgage-backed security (MBS) with the first
four principal components of yield curve.

Continue reading "Hedging beyond duration and convexity" »

July 10, 2006

Haver data

Haver Analystics provides economic data, ready to use
in Stata and eViews formats.

PCE time series inflationary ?

July 7, 2006

Sparklines time series

Show the time series with a sparkline.
Sparklines wiki.
Go mad with stock charts.

US Federal Budget deficit, 1983-2003.

June 27, 2006

Zivot on time series

Zivot's class in time series econometrics notes.

May 25, 2006

Unobserved Components Model, Proc UCM

Underlying model and several of the features of Proc UCM, new in the
Econometrics and Time Series (ETS) module of SAS .

Time series data is generated by marketers as they monitor “sales by month”
and by medical researchers who collect vital sign information over time. This
technique is well suited to modeling the effect of interventions (drug administration
or a change in a marketing plan). This new procedure combines the flexibility of
Proc ARIMA with the ease of use and interpretability of Smoothing models.

UCM does not have the capability to easily model transfer functions, a useful
ARIMA function that is planned for Proc UCM.

An Animated Guide©: Proc UCM (Unobserved Components Model)
Russ Lavery, Contractor for ASG, Inc., PDF

May 24, 2006

Econometric notes

Econometric course notes by John Aldrich.

May 23, 2006

SURSE

Seemingly unrelated regressions and simulateous equations: PDF

May 22, 2006

Statespace is SAS

Statespace in SAS/ETS.

The STATESPACE procedure analyzes and forecasts multivariate
time series using the state space model. The STATESPACE procedure
is appropriate for jointly forecasting several related time series that
have dynamic interactions. By taking into account the autocorrelations
among the whole set of variables, the STATESPACE procedure may
give better forecasts than methods that model each series separately.

May 15, 2006

NumSum spreadsheets on the web

Spreadsheets put on the web by NumSum.
Like Flickr for accountants.

Continue reading "NumSum spreadsheets on the web" »

April 18, 2006

Home value by room count, Miller Samuel

Home value by rooms by Miller Samuel.
This regression is crying out for a log transformation.

And what do all the data points with fractional room counts represent ?

*

April 4, 2006

Dashboard spy

Dashboard spy gallery of mangement dashboards and consoles full of KPI
(Key performance indicators).
Update 2006 Dec.: Moved to enterprise-dashboard.com.

Ed Tufte adds,

Continue reading "Dashboard spy" »

December 22, 2005

Kimberly 'KC' Claffy

Kimberly 'KC' Claffy measures internet traffic.

December 1, 2005

log base 2

logbase2 is mostly biostatistics and visualization,
with a blast of r.

Bonus (detritus ?): And compliant lefty Canadian commentary.

October 27, 2005

Google News Report USA Score

Fetch headlines from Google News on a schedule, then rank
headlines by factors:

* appearance day and time,
* prominence on the google news page,
* number of appearances,
* others;

weighted to estimate referer traffic these links bring to their
source.

Listed are the top scoring stories in recent time periods, followed
by a ranking of sources. More detailed reports are linked-to at the
bottom of each table.

[*]

October 15, 2005

Joint regression analysis

Joint regression analysis to study genotype-environmental interaction,
genotype effects and/or interaction effects within individual
environments are related to environmental effects.

The interaction sum of squares is divided into two parts:
* one part represents the heterogeneity of linear regression
coefficients while
* the second represents the pooled deviations from individual
regression lines.

R. J. (Bob) Baker

September 8, 2005

Hospital Length of Stay: Mean or Median Regression

Length of stay (LOS) is an important measure of hospital activity and
health care utilization, but its empirical distribution is often
positively skewed.

Median regression appears to be a suitable alternative to analyze
the clustered and positively skewed LOS, without transforming and
trimming the data arbitrarily.

Continue reading "Hospital Length of Stay: Mean or Median Regression" »

August 29, 2005

r graphics (Paul Murrell) is out

R Graphics by Paul Murrell shipped.

Previously announced.

Continue reading "r graphics (Paul Murrell) is out" »

August 24, 2005

MCMC method bandwidth selection for multivariate kernel density estimation

Kernel density estimation for multivariate data is an important
technique that has a wide range of applications in econometrics and
finance. The lower level of its use is mainly due to the increased
difficulty in deriving an optimal data-driven bandwidth as the
dimension of data increases. We provide Markov chain Monte Carlo
(MCMC) algorithms for estimating optimal bandwidth matrices for
multivariate kernel density estimation.

Our approach is based on treating the elements of the bandwidth matrix
as parameters whose posterior density can be obtained through the
likelihood cross-validation criterion. Numerical studies for bivariate
data show that the MCMC algorithm generally performs better than the
plug-in algorithm under the Kullback-Leibler information criterion.
Numerical studies for five dimensional data show that our algorithm is
superior to the normal reference rule.

Continue reading "MCMC method bandwidth selection for multivariate kernel density estimation" »

August 23, 2005

Curve Forecasting by Functional Autoregression

This paper explores prediction in time series in which the data is
generated by a curve-valued autoregression process. It develops a
novel technique, the predictive factor decomposition, for estimation
of the autoregression operator, which is designed to be better suited
for prediction purposes than the principal components method.

The technique is based on finding a reduced-rank approximation to the
autoregression operator that minimizes the norm of the expected
prediction error. The new method is illustrated by an analysis of the
dynamics of Eurodollar futures rates term structure. We restrict the
sample to the period of normal growth and find that in this subsample
the predictive factor technique not only outperforms the principal
components method but also performs on par with the best available
prediction methods.

Curve Forecasting by Functional Autoregression
Presenter(s) Alexei Onatski, Columbia University
Co-Author(s) Vladislav Kargin, Cornerstone Research
Session Chair James Stock, Harvard University

Continue reading "Curve Forecasting by Functional Autoregression" »

August 20, 2005

Functional data analysis (FDA)

Functional data analysis (FDA) handles longitudinal data and treats
each observation as a function of time (or other variable). The
functions are related. The goal is to analyze a sample of functions
instead of a sample of related points.

FDA differs from traditional data analytic techniques in a number of
ways. Functions can be evaluated at any point in their domain.
Derivatives and integrals, which may provide better information (e.g.
graphical) than the original data, are easily computed and used in
multivariate and other functional analytic methods.


S+Functional Data Analysis User's Guide
by Douglas B. Clarkson, Chris Fraley, Charles C. Gu, James O. Ramsay


Functional Data Analysis (Springer Series in Statistics) (Hardcover)
by J. Ramsay, B. W. Silverman

Covers topics of linear models, principal components, canonical
correlation, and principal differential analysis in function spaces.


Applied Functional Data Analysis
(Paperback)
by J.O. Ramsay, B.W. Silverman

Bernard W. Silverman's code site Applied Functional Data Analysis: Methods and Case Studies

Continue reading "Functional data analysis (FDA)" »

August 19, 2005

Mathematical Statistics with MATHEMATICA

Mathematical Statistics with MATHEMATICA,
Colin Rose, Murray D. Smith (Hardcover)


The mathStatica software, an add-on to Mathematica, provides a
toolset specially designed for doing mathematical statistics. It
enables students to solve difficult problems by removing the technical
calculations often associated with mathematical statistics. The
professional statistician will be able to tackle tricky multivariate
distributions, generating functions, inversion theorems, symbolic
maximum likelihood estimation, unbiased estimation, and the checking
and correcting of textbook formulas. This text would be a useful
companion for researchers and students in statistics, econometrics,
engineering, physics, psychometrics, economics, finance, biometrics,
and the social sciences.

Companion site mathStatica.com

August 4, 2005

Information Visualisation with r

Information Visualisation Lecture Slides uses r.

Continue reading "Information Visualisation with r" »

July 21, 2005

Asset prices by Enricode Giorgi

Default models and asset pricing models at Enricode Giorgi's resource,
some with correlated defaults.

July 19, 2005

sas proc quantreg for quantile regression

Some PROC QUANTREG features are:

* Implements the simplex, interior point, and smoothing algorithms for
estimation

* Provides three methods to compute confidence intervals for the
regression quantile parameter: sparsity, rank, and resampling.

* Provides two methods to compute the covariance and correlation
matrices of the estimated parameters: an asymptotic method and a
bootstrap method

* Provides two tests for the regression parameter estimates: the Wald
test and a likelihood ratio test

* Uses robust multivariate location and scale estimates for leverage
point detection

* Multithreaded for parallel computing when multiple processors are
available

[PDF, *]

July 17, 2005

SAS examples with explanation at ucla.edu/stat/SAS/

SAS examples with explanation abound at UCLA: 1, 2.

July 10, 2005

Array manipulation: Perl Data Language (PDL) and piddles

To COMPACTLY store and SPEEDILY manipulate the large
N-dimensional data sets which are the bread and butter
of scientific computing. e.g. $a=$b+$c can add two
2048x2048 images in only a fraction of a second.

Perl Data Language (PDL), PDL::Impatient - PDL for the impatient

A PDL scalar variable (an instance of a particular class of
perl object, i.e. blessed thingie) is a piddle.

June 17, 2005

state of stats

What have we learnt ? State of stats: PDF, Antony Unwin on Statistical Learning.
Global criteria: – AIC, BIC, deviance, test error,...
Local criteria: – residuals, diagnostics

Continue reading "state of stats" »

June 16, 2005

Support Vector Machine

An SVM corresponds to a linear method in a very high dimensional feature
space which is nonlinearly related to the input space. It does not
involve any computations in that high dimensional space. By the use of
kernels, all necessary computations are performed directly in input space.

are a method for creating functions from a set of labeled training
data. The function can be a classification function (the output is
binary: is the input in a category) or the function can be a general
regression function.

For classification, SVMs operate by finding a hypersurface in the
space of possible inputs. This hypersurface will attempt to split the
positive examples from the negative examples. The split will be chosen
to have the largest distance from the hypersurface to the nearest of
the positive and negative examples. Intuitively, this makes the
classification correct for testing data that is near, but not
identical to the training data.


r (with module e1071):
estimate, predict, example, example2.

Matlab:
Kernel Methods for Pattern Analysis
John Shawe-Taylor & Nello Cristianini
Cambridge University Press, 2004
Detailed contents, inventory of algorithms and kernels, and matlab code.

Stand-alone:

SVM Light is a Support Vector Machine.

Continue reading "Support Vector Machine" »

June 15, 2005

Spectral Graph Transducer, SGTlight

SGTlight is an implementation of a Spectral Graph Transducer (SGT)
[Joachims, 2003] in C using Matlab libraries. The SGT is a method for
transductive learning. It solves a normalized-cut (or ratio-cut) problem
with additional constraints for the labeled examples using spectral
methods. The approach is efficient enough to handle datasets with
several ten-thousands of examples.

June 14, 2005

Analysis of patterns

Analysis of patterns

Automatic pattern analysis of data is a pillar of modern science,
technology and business, with deep roots in statistics, machine
learning, pattern recognition, theoretical computer science, and many
other fields. A unified conceptual understanding of this strategic
field is of utmost importance for researchers as well as for users of
this technology.

This workshop - course will emphasizes the common principles and roots
of modern pattern analysis technology, developed independently by many
different scientific communities over the past 30 years, and their
impact on modern science and technology.

Students and researchers from many disciplienes dealing with automatic
pattern analysis form the intended audience. These include (but are
not limited to) statistics, pattern recognition, data mining, machine
learning, information theory, sequence analysis, bioinformatics,
adaptive systems, etc.

Italy, October 28 - November 6, 2005

June 13, 2005

Data mining competition

Fair Isaac and UCSD data mining competition lets you test your predictive power.

May 3, 2005

Kalman filter with Mathematica

Kalman filter (An algorithm in control theory introduced by R. Kalman in 1960 and
refined by Kalman and R. Bucy. It is an algorithm which makes optimal use of imprecise
data on a linear (or nearly linear) system with Gaussian errors to continuously update
the best estimate of the system's current state.)

As a times series function (example); as an estimator for linear
(time series and panel) models with time-varying coefficients
.

Continue reading "Kalman filter with Mathematica" »

April 29, 2005

Decision Science News / Dan Goldstein

Decision Science News by Dan Goldstein and Kevin Flora
about the decision sciences including but not limited to Psychology,
Economics, Business, Medicine, and Law, but
mostly marketing.

Also on Wilmott.

April 28, 2005

Statistical Modeling, Causal Inference / MLM

Statistical Modeling, Causal Inference, and Social Science (MLM)
Andrew Gelman and Samantha Cook at Columbia.

April 27, 2005

XLISP-Stat estimates Generalised Estimating Equations

XLISP-Stat tools for building Generalised Estimating Equation models
offers an introduction to GEE models.

Much of the brain trust of XLISP Stat has moved on to r.

Continue reading "XLISP-Stat estimates Generalised Estimating Equations" »

April 19, 2005

r graphics, Paul Murrell

R Graphics by Paul Murrell

Update 2005 Sept 03: R Graphics is shipping !

A book on the core graphics facilities of the R language and
environment for statistical computing and graphics (to be published
by Chapman & Hall/CRC in August 2005). Preview now.

March 25, 2005

Wavelets

Wavelets are mathematical expansions that transform data from the
time domain into different layers of frequency levels. Compared to
standard Fourier analysis, they have the advantage [PDF] of being
localized both in time and in the frequency domain, and enable the
researcher to observe and analyze data at different scales.

Continue reading "Wavelets" »

February 1, 2005

Exploratory Data Analysis in NIST's Statistics Handbook

NIST's Engineering Statistics Handbook: Exploratory Data Analysis.

January 31, 2005

Basel default

Probability of Default (PD)
- the probability that a specific customer will default
within the next 12 months.

Loss Given Default (LGD)
- the percentage of each credit facility that will be lost
if the customer defaults.

Exposure at Default (EAD)
- the expected exposure for each credit facility in the
event of a default.

Continue reading "Basel default" »

January 29, 2005

How Ratings Agencies Achieve Rating Stability

Surveys on the use of agency credit ratings reveal that some
investors believe that rating agencies are relatively slow in
adjusting their ratings. A well-accepted explanation for this
perception on the timeliness of ratings is the "through-the-cycle"
methodology that agencies use. According to Moody's, through-the-cycle
ratings are stable because they are intended to measure the risk of
default risk over long investment horizons, and because they are
changed only when agencies are confident that observed changes in a
company's risk profile are likely to be permanent. To verify this
explanation, we quantify the impact of the long-term default horizon
and the prudent migration policy on rating stability from the
perspective of an investor - with no desire for rating stability. This
is done by benchmarking agency ratings with a financial ratio-based
(credit scoring) agency-rating prediction model and (credit scoring)
default-prediction models of various time horizons. We also examine
rating migration practices. Final result is a better quantitative
understanding of the through-the-cycle methodology.

By varying the time horizon in the estimation of default-prediction
models, we search for a best match with the agency-rating prediction
model. Consistent with the agencies' stated objectives, we conclude
that agency ratings are focused on the long term. In contrast to
one-year default prediction models, agency ratings place less weight
on short-term indicators of credit quality.

We also demonstrate that the focus of agencies on long investment
horizons explains only part of the relative stability of agency
ratings. The other aspect of through-the-cycle rating methodology -
agency rating-migration policy - is an even more important factor
underlying the stability of agency ratings. We find that rating
migrations are triggered when the difference between the actual agency
rating and the model predicted rating exceeds a certain threshold
level. When rating migrations are triggered, agencies adjust their
ratings only partially, consistent with the known serial dependency of
agency rating migrations.

Continue reading "How Ratings Agencies Achieve Rating Stability" »

January 26, 2005

Web mathematica takes derivatives.

Web Mathematica takes derivatives.

January 23, 2005

Treeage statistical software for non-statistician

TreeAge offers statistical software for non-statisticians.

Features include sensitivity analysis and distribution graphs.

January 22, 2005

Belief Networks and Decision Networks

Belief networks (also known as Bayesian networks, Bayes networks and
causal probabilistic networks), provide a method to represent
relationships between propositions or variables, even if the
relationships involve uncertainty, unpredictability or imprecision.

They may be learned automatically from data files, created by an
expert, or developed by a combination of the two. They capture
knowledge in a modular form that can be transported from one situation
to another; it is a form people can understand, and which allows a
clear visualization of the relationships involved.

By adding decision variables (things that can be controlled), and
utility variables (things we want to optimize) to the relationships of
a belief network, a decision network (also known as an influence
diagram) is formed. This can be used to find optimal decisions,
control systems, or plans.

Continue reading "Belief Networks and Decision Networks" »

January 21, 2005

Agena Risk bayesian network

Agena Risk bayesian network analysis software and whitepapers.

January 14, 2005

Bayesian Methods for Improving Credit Scoring Models

Abstract: We propose a Bayesian methodology that enables banks with
small datasets to improve their default probability estimates by
imposing prior information. As prior information, we use coefficients
from credit scoring models estimated on other datasets. Through
simulations, we explore the default prediction power of three Bayesian
estimators in three different scenarios and find that all three
perform better than standard maximum likelihood estimates. We
therefore recommend that banks consider Bayesian estimation for
internal and regulatory default prediction models.

Keywords: Credit Ratings, Rating Agency, Bayesian Inference, Basel II

JEL Classification: C11, G21, G33

Continue reading "Bayesian Methods for Improving Credit Scoring Models" »

January 13, 2005

Receiver Operating Characteristic (ROC)

ROC.

The ability of a test to discriminate diseased cases from normal cases
is evaluated using Receiver Operating Characteristic (ROC) curve
analysis (Metz, 1978; Zweig & Campbell, 1993). ROC curves can also be
used to compare the diagnostic performance of two or more laboratory or
diagnostic tests (Griner et al., 1981).

January 12, 2005

Lindeberg's central limit theorem

Lindeberg's Central Limit Theorem at Planetmath.

January 7, 2005

TreeBoost - Stochastic Gradient Boosting

TreeBoost - Stochastic Gradient Boosting.

"Boosting" is a technique for improving the accuracy of a predictive
function by applying the function repeatedly in a series and combining
the output of each function with weighting so that the total error of
the prediction is minimized. In many cases, the predictive accuracy of
such a series greatly exceeds the accuracy of the base function used
alone.

January 2, 2005

Correlation Monger

Correlation monger provides pair-wise correlation of
demographic variables across 50 US states. For example,
Canadians increase property values.

December 17, 2004

MedCalc basic statisitical features.

MedCalc has good list of basic statisitical features.

# Stepwise Multiple regression

# Stepwise Logistic regression

# Paired and unpaired t-tests

# Rank sum tests: Wilcoxon test (paired data), Mann-Whitney U test (unpaired data)

# Variance ratio test (F-test)

# One-way analysis of variance (ANOVA) with Student-Newman-Keuls (SNK) test for pairwise comparison of subgroups

# Two-way analysis of variance

# Kruskal-Wallis test

# Frequencies table, crosstabulation analysis, Chi-square test, Chi-square test for trend

# Tests on 2x2 tables: Fisher's exact test, McNemar test

# Frequencies bar charts

# Kaplan-Meier survival curve, logrank test for comparison of survival curves, hazard ratio, logrank test for trend

# Cox proportional-hazards regression

# Meta-analysis: odds ratio (random effects or fixed effects model - Mantel-Heinszel method); summary effects for continuous outcomes; Forest plot

# Reference interval (normal range)

# Analysis of Serial measurements with group comparison

# Bland & Altman plot for method comparison (bias plot) - repeatability

December 9, 2004

Combining trees with CART

Salford CART allows one to choose from several ways of combining
separate CART trees into a single predictive engine. The
trees are combined by either averaging their outputs for
regression or by using an unweighted plurality voting scheme
for classification. The current version of CART offers two
combination methods: Bootstrap aggregation and ARCing. Each
generates a set of trees by resampling (with replacement)
from the original training data.

December 7, 2004

S-PLUS Predictive Modeling and Computational Finance

S-PLUS Predictive Modeling and Computational Finance
event with abstracts.

Nov 2004 Finance Event Proceedings for LossCalc II: Dynamic Prediction of LGD.
Greg Gupton, Moody's KMV

We describe LossCalc(tm) version 2.0, the Moody's KMV model to predict
loss given default (LGD). LGD is of natural interest to lenders and
investors wishing to estimate future credit losses. LossCalc is a
robust and validated model of LGD for loans and bonds globally.
LossCalc is a statistical model that incorporates information at all levels:
collateral, instrument, firm, industry, country, and the macroeconomy
to predict LGD. Also, and what may be more interesting than merely
having a powerful predictive model, is to see and understand the
underlying drivers of default recovery/loss that we show.

Continue reading "S-PLUS Predictive Modeling and Computational Finance" »

December 2, 2004

Edward Malthouse, data mining

Edward Malthouse's data mining course (DM).

November 25, 2004

r project for statistical computing

The r project for statistical computing is an open source companion
to S, S-Plus, successor to XLispStat, and
more.

Whereas SAS and SPSS will give copious output from a regression
or discriminant analysis, R will give minimal output and store the
results in a fit object for subsequent interrogation by further R
functions.

manuals [HTML]
Sample R session


R is an integrated suite of software facilities for data
manipulation, calculation and graphical display. Among
other things it has

* an effective data handling and storage facility,

* a suite of operators for calculations on arrays,
in particular matrices,

* a large, coherent, integrated collection of intermediate
tools for data analysis.

* graphical facilities for data analysis and display
either directly at the computer or on hardcopy.

* a well developed, simple and effective programming
language (called `S') which includes conditionals,
loops, user defined recursive functions and input
and output facilities. (Indeed most of the system
supplied functions are themselves written in the
S language.)